
Most people don’t think much about where their tap water ranks until something goes wrong – a boil-water notice in the next county, a news story about lead pipes three towns over, a neighbor who swears she stopped drinking from the faucet years ago and has never felt better. Water quality is tracked through a web of federal compliance records, state-level enforcement data, contaminant testing results, and infrastructure assessments, none of which are especially easy to parse at the kitchen sink on a Tuesday morning.
Good state water quality comes down to a few overlapping factors: how often water systems rack up violations of the Safe Drinking Water Act, how many contaminants are detected and at what levels, how robustly the state funds and enforces its monitoring programs, and whether the physical infrastructure delivering water to homes is modern enough to get it there without adding problems along the way. A state can have pristine source water and still fall short if its pipes are ancient or its utilities underfunded.
What the Data Shows
The rankings below draw on multiple 2024–2026 analyses of EPA data, including violation counts, population-weighted compliance scores, and contaminant detection records. No two methodologies produce an identical list, but the states that appear here consistently float to the top across sources.
Multiple data sources inform these rankings, including a ProGuard analysis of 2024 EPA data covering Safe Drinking Water Act violation counts per 100,000 residents, TapWaterData.com’s 2026 rankings using population-weighted EPA scores, Frizzlife’s 2025 guide covering PFAS details in specific states, and WaterQualityHub’s state-by-state analysis cross-referencing EPA and independent contaminant data.
1. Hawaii
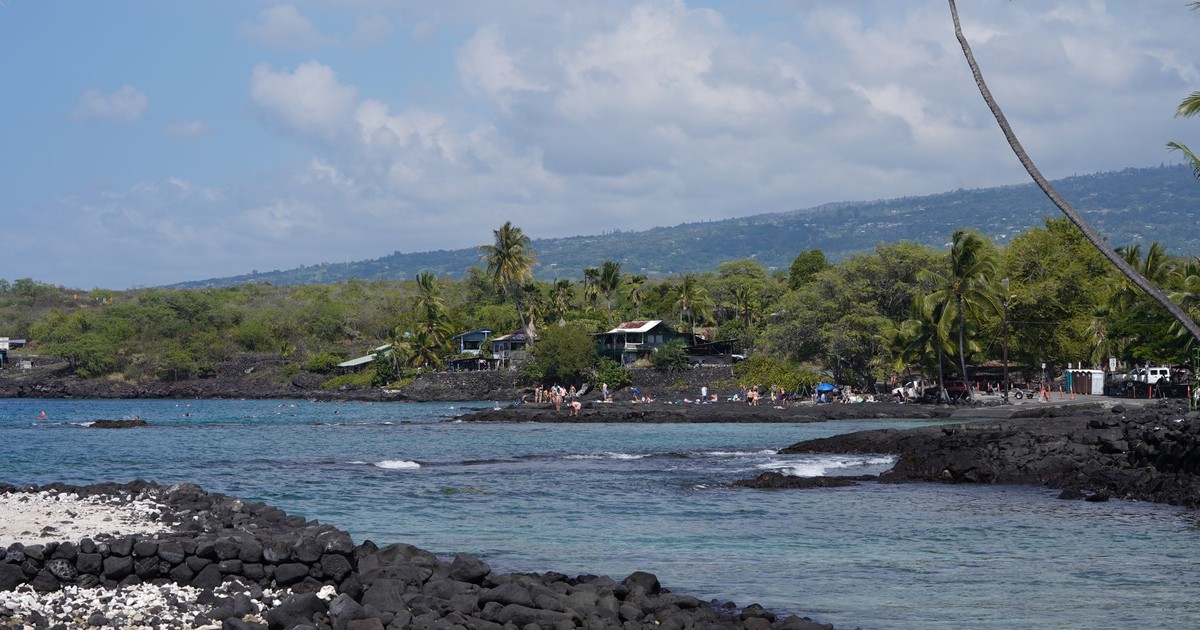
Hawaii ranks #1 for the cleanest tap water in the US with a grade of A and a score of 99.9 out of 100, based on population-weighted EPA data. Hawaii recorded the cleanest tap water with 156.42 water quality violations per 100,000 residents, the best performance across all states.
The geography helps enormously. Hawaii’s drinking water is drawn primarily from underground aquifers and groundwater, which are naturally filtered through volcanic rock before they ever reach a treatment plant.
Across multiple independent analyses using EPA’s Safe Drinking Water Information System – tracking everything from monitoring failures to health-based violations – Hawaii consistently outperforms every other state.
2. South Carolina

South Carolina ranks first in a December 2025 combined analysis drawing on EPA and Environmental Working Group data, which weighted health-based violations, contaminant detection, and oversight of public water systems across a five-year period.
South Carolina benefits from a combination of well-maintained surface water sources and relatively strong state-level oversight. Systems in the top-performing states tend to have fewer violations of the Safe Drinking Water Act and lower levels of contaminants like nitrates, lead, and disinfection byproducts. South Carolina’s utilities, particularly in its larger metro areas, have invested consistently in infrastructure that keeps those numbers down.
Water quality in South Carolina varies by municipality. Rural systems with smaller budgets face different pressures than the major metro utilities. But statewide, the compliance picture is strong enough to earn it a consistent place at the top of national rankings.
3. Minnesota
The Minnesota Department of Health runs one of the more proactive state drinking water programs in the country. They’ve been particularly aggressive about identifying and replacing lead service lines ahead of the federal mandate timeline.
Minneapolis’s 2024 Consumer Confidence Report confirmed the city recorded zero violations of federal drinking water standards for the entire calendar year. Minnesota secured third place with 184.18 violations per 100,000 people in the ProGuard analysis of 2024 EPA data, making it one of the three cleanest states in the country by that measure.
US Water Score, which uses a July 2026 snapshot of EPA’s Safe Drinking Water Information System alongside PFAS monitoring data, gives Minnesota an A grade with a score of 92 out of 100. For a large state with significant agricultural activity – a sector that can push nitrate levels up in groundwater – that score reflects genuine infrastructure investment.
4. North Dakota
North Dakota ranks fourth in a December 2025 combined EPA and EWG analysis, sitting just behind Minnesota in a cluster of Midwestern states that consistently outperform more populous parts of the country.
The state’s relatively low population density works in its favor. Fewer industrial polluters, less agricultural runoff pressure on urban water systems, and a smaller network of aging urban pipes all contribute to lower violation rates. US Water Score gives North Dakota an A grade with a score of 91 out of 100 in its 2026 assessment using the latest EPA SDWIS data.
The state’s utilities may not be famous, but they do the unglamorous work of keeping contaminant levels low year after year, and the numbers reflect it.
5. Maryland
Maryland’s position in the top five reflects both strong state enforcement and the investment its major metro systems have made in treatment infrastructure. The Chesapeake Bay watershed that covers much of the state has historically driven significant attention to water quality from both environmental and public health angles, and that attention has produced results at the tap.
Maryland ranks fifth in the combined EPA and EWG analysis from December 2025. The state’s water systems in the Baltimore and suburban DC corridors have posted consistently low violation rates, and Maryland has been among the states investing in lead service line replacement programs ahead of federal deadlines. For a densely populated state with a substantial amount of older housing stock, that’s meaningful.
The states with the best tap water in the US tend to share four traits: good protection of water sources, strict standards and enforcement, consistent investment in treatment systems, and clear communication with the public. Maryland checks those boxes, particularly the enforcement and investment ones.
6. Alabama
Alabama places sixth nationally with 233.01 violations per 100,000 residents in the 2024 EPA data analysis – a genuinely strong result for a Southern state that doesn’t typically top quality-of-life indices in public perception. The state draws on a diverse mix of surface water and groundwater sources, and its larger utilities have maintained solid compliance records.
Hawaii beats the rest of the states with water mainly sourced from underground aquifers and groundwater, and Tennessee and Alabama rank second and third, respectively, thanks to a variety of water sources. That variety is a real advantage – states that aren’t overly dependent on a single source type tend to have more resilience when one supply faces pressure.
Alabama’s performance also reflects the investment its larger municipal systems have made in treatment capacity. Water quality doesn’t map neatly onto state wealth or political profile – it maps onto utility management and infrastructure spending, which can produce strong results in unexpected places.
7. Michigan
The Flint water crisis – which began in 2014 and involved dangerous lead contamination affecting thousands of residents – was a catastrophic failure of infrastructure and oversight that the state has spent years working to address. That crisis is part of Michigan’s water story.
The current data also shows that Michigan’s broader statewide compliance picture has improved substantially. Michigan places ninth nationally with 261.06 violations per 100,000 residents in the 2024 EPA data – a result that reflects the aggressive remediation and system upgrades the state has pursued across many of its utilities in the years since Flint. Michigan ranks seventh in a December 2025 combined EPA and EWG scoring, which accounts for multiple metrics including health-based violations and contaminant detection levels.
Statewide averages can obscure both disasters and recoveries. The state’s aggregate numbers are now genuinely strong, even as Flint’s story rightly remains a case study in what happens when cost-cutting overrides public health.
8. Wisconsin
Wisconsin sits in the top tier for a state that faces real challenges from agricultural runoff – particularly nitrates from farm operations that can seep into groundwater. The fact that it maintains strong statewide compliance despite that pressure speaks to consistent regulatory attention and investment in monitoring.
The state’s larger systems – Milwaukee, Madison, Green Bay – have posted strong recent compliance records, and Wisconsin’s Department of Natural Resources has maintained active oversight of public water suppliers through its Drinking Water and Groundwater Program. Madison in particular has earned recognition for its water quality programs, drawing on a combination of deep aquifer sources and rigorous testing protocols.
For families with young children, nitrates are a specific concern to watch in any agricultural state, because elevated nitrate levels carry particular health risks for infants. Wisconsin’s statewide numbers are strong, but checking your local Consumer Confidence Report – especially if you’re in a rural area near farmland – remains the right move.
9. South Dakota
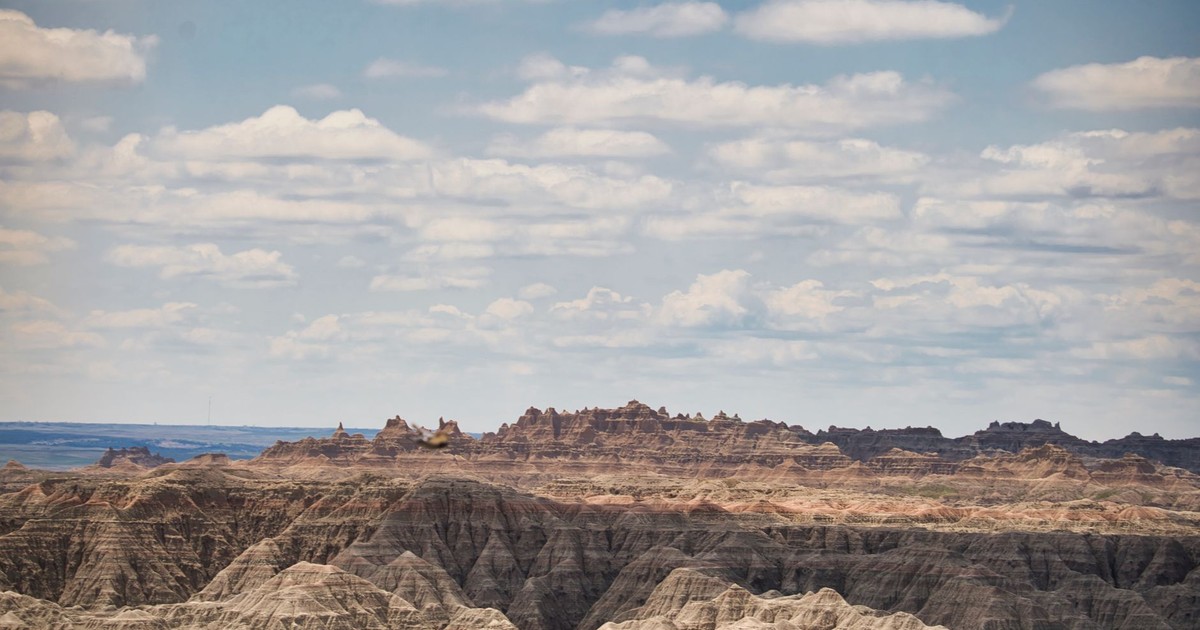
Around 95% of people on public water systems in South Dakota have water that meets all EPA health standards, and that consistency is what keeps the state in elite company year after year. One large regional system has earned a federal Secretary’s Award for Drinking Water Excellence for more than 15 years in a row, showing strong regular testing and treatment performance.
The state relies on well-protected rivers and aquifers and invests in water treatment plants and operator training. In a rural state with relatively small population centers, keeping utilities well-staffed and well-trained is an ongoing challenge that South Dakota has met more consistently than most comparable states.
For a state that doesn’t make many national headlines, South Dakota’s drinking water record is genuinely impressive.
10. New Hampshire
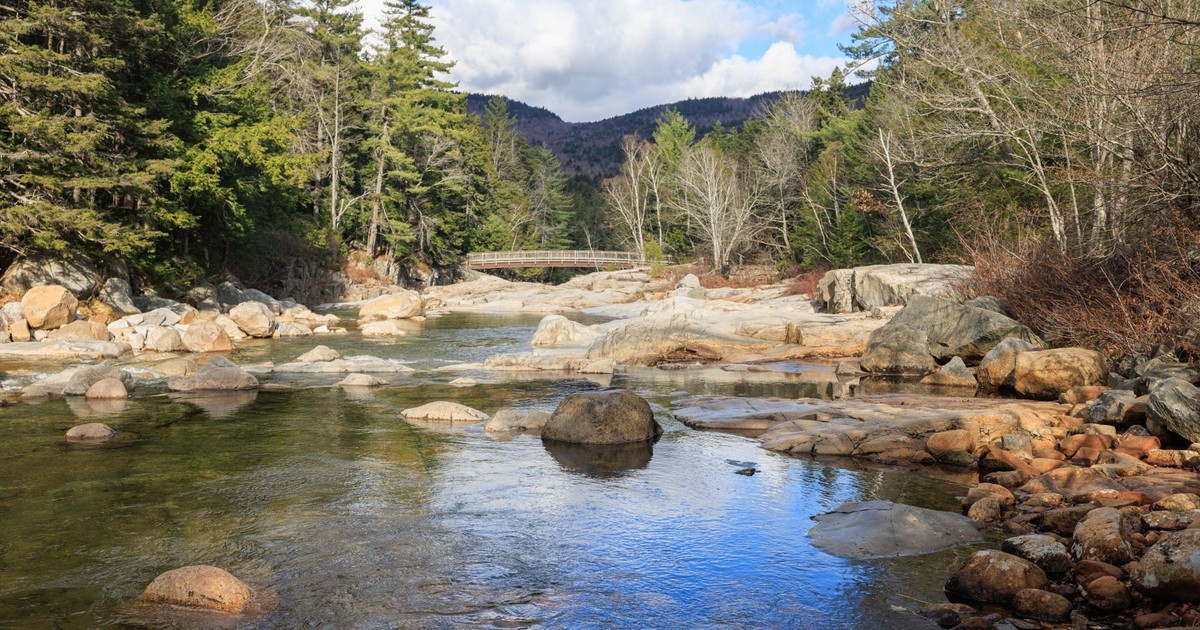
New Hampshire is one of the standout performers in the Northeast, a region where older housing stock and industrial history create real water quality challenges. What separates New Hampshire is the aggressiveness of its state-level regulation. New Hampshire has some of the strictest PFAS rules in the US, often tighter than federal limits. PFAS – per- and polyfluoroalkyl substances, sometimes called “forever chemicals” because they don’t break down naturally – are among the most discussed contaminants in American drinking water right now, and New Hampshire’s approach to them is ahead of most states.
Utilities in New Hampshire must conduct regular testing for PFAS and other emerging contaminants, so residents often get early warnings and clear Consumer Confidence Reports. A state where utilities are required to tell residents what’s in their water – clearly, on a schedule, without waiting for a crisis – is a state where problems get caught and addressed earlier.
The drinking water in New Hampshire is cleaner than most states thanks to the state’s filtration process and environmental protection acts.
11. Georgia

Georgia’s position in the top 12 reflects strong performance from its major metro water systems, particularly in the Atlanta corridor. Georgia ranks eleventh in a December 2025 combined EPA and EWG analysis, placing it ahead of states like Vermont, Iowa, and Tennessee in that particular scoring framework.
Georgia’s water systems draw from a mix of surface water reservoirs and river sources, and the state’s larger utilities have consistently maintained low violation rates. The Metropolitan North Georgia Water Planning District, which coordinates water management across the Atlanta metro area, has been a driving force in infrastructure investment and quality monitoring across one of the South’s most populous regions.
As with every state, Georgia’s rural systems present a more variable picture than the metro averages suggest. But statewide, the compliance record earned Georgia a consistent spot among the top performers in analyses using both EPA regulatory data and independent contaminant assessments.
12. Virginia

Virginia closes out the list with a strong statewide compliance record built on protected watershed sources and well-funded utility systems. The Northern Virginia region, drawing on Potomac River sources treated through some of the most sophisticated treatment facilities in the country, consistently records low contaminant levels. Virginia ranks twelfth in a December 2025 combined EPA and EWG analysis.
The state’s water story also includes a notable 2026 recognition: the American Water Works Association highlighted Henrico County, Virginia with major recognition. Henrico County’s approach – strong source protection, aggressive testing, clear public communication – is the model that puts Virginia’s utilities among the country’s best.
US Water Score gives Virginia a B grade with a score of 87 out of 100 in its 2026 assessment, which is solid for a state with significant geographic diversity, from dense suburban corridors to rural Appalachian communities with very different infrastructure realities.
Read More: Is It Safe To Drink Water From The Bathroom?
What the Rankings Don’t Tell You
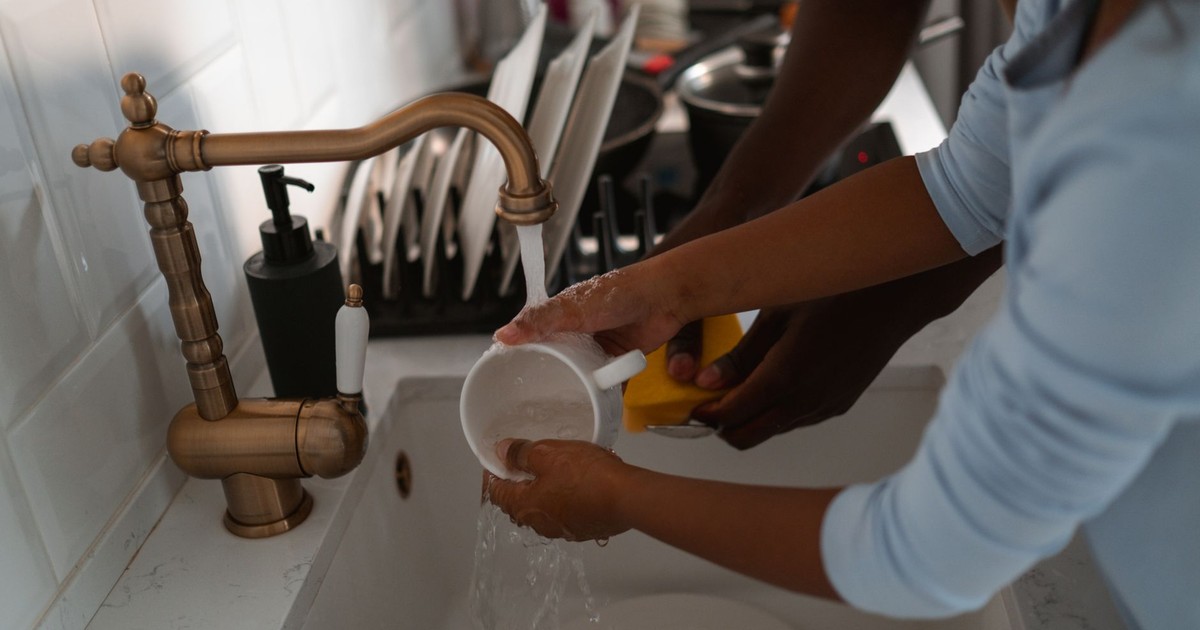
The states on this list genuinely have strong water quality records – but “strong statewide record” and “safe water at your address” are not the same sentence. Tap water quality within each state varies greatly, and a state’s aggregate performance can mask real problems in specific municipalities, rural systems, or older neighborhoods where lead service lines haven’t yet been replaced.
Every water utility in the country is required to publish an annual Consumer Confidence Report – a document that tells you exactly what was detected in your local water supply and at what levels. If you’ve never read yours, it’s worth ten minutes.
If you have children under two or are pregnant, the contaminant levels in your specific local report matter more than your state’s average ranking. If you live in a home built before 1986, the pipes between the street and your tap are worth asking about, regardless of how well your state scores.
If you’re curious about toxic kitchen items that might be adding chemical exposure beyond what’s coming from the tap, that’s a separate rabbit hole worth knowing about. The water coming into your home is only part of the picture. What happens to it once it gets inside is another question entirely.
Disclaimer: This information is not intended to be a substitute for professional medical advice, diagnosis, or treatment and is for information only. Always seek the advice of your physician or another qualified health provider with any questions about your medical condition and/or current medication. Do not disregard professional medical advice or delay seeking advice or treatment because of something you have read here.
AI Disclaimer: This article was created with the assistance of AI tools and reviewed by a human editor.